Rising Seas in the Chesapeake Bay
The Chesapeake Bay is experiencing noticeable changes as sea levels continue to rise. While rising seas are a global phenomenon, factors like land subsidence make the Bay particularly vulnerable to the impacts of higher water levels. These shifts are already affecting coastal areas, increasing the frequency of flooding and putting homes, businesses, and critical habitats at risk.
Understanding these changes is an important step toward creating a resilient future for the Chesapeake Bay and its iconic coastline.
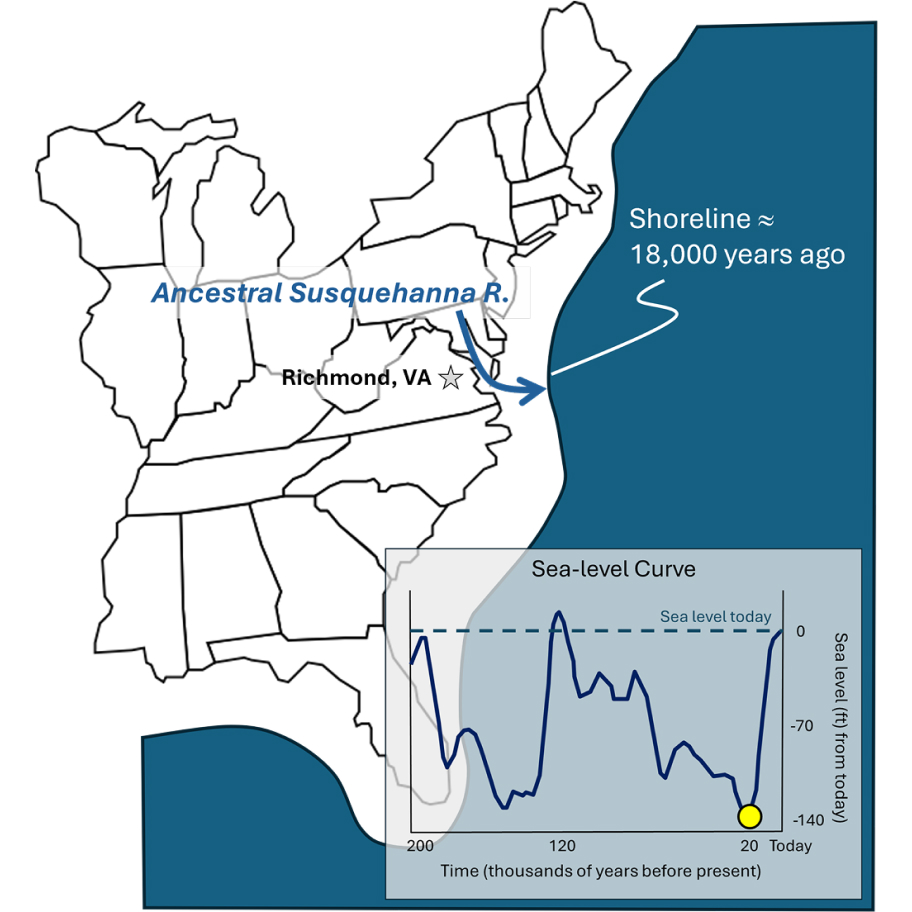
The Chesapeake Bay’s 18,000-Year Story of Rising Seas
18,000 years ago
The Chesapeake Bay didn’t exist a few thousand years ago, sea levels were about 135 m (400 feet) lower than today, and the ancestral Susquehanna River flowed about 75 miles farther east to reach the ocean. About 18,000 years ago, continental glaciers around the world began melting and sea level began rising closer to the present-day shoreline and into the ancestral Susquehanna River valley.

10,000 to 2,000 Years Ago
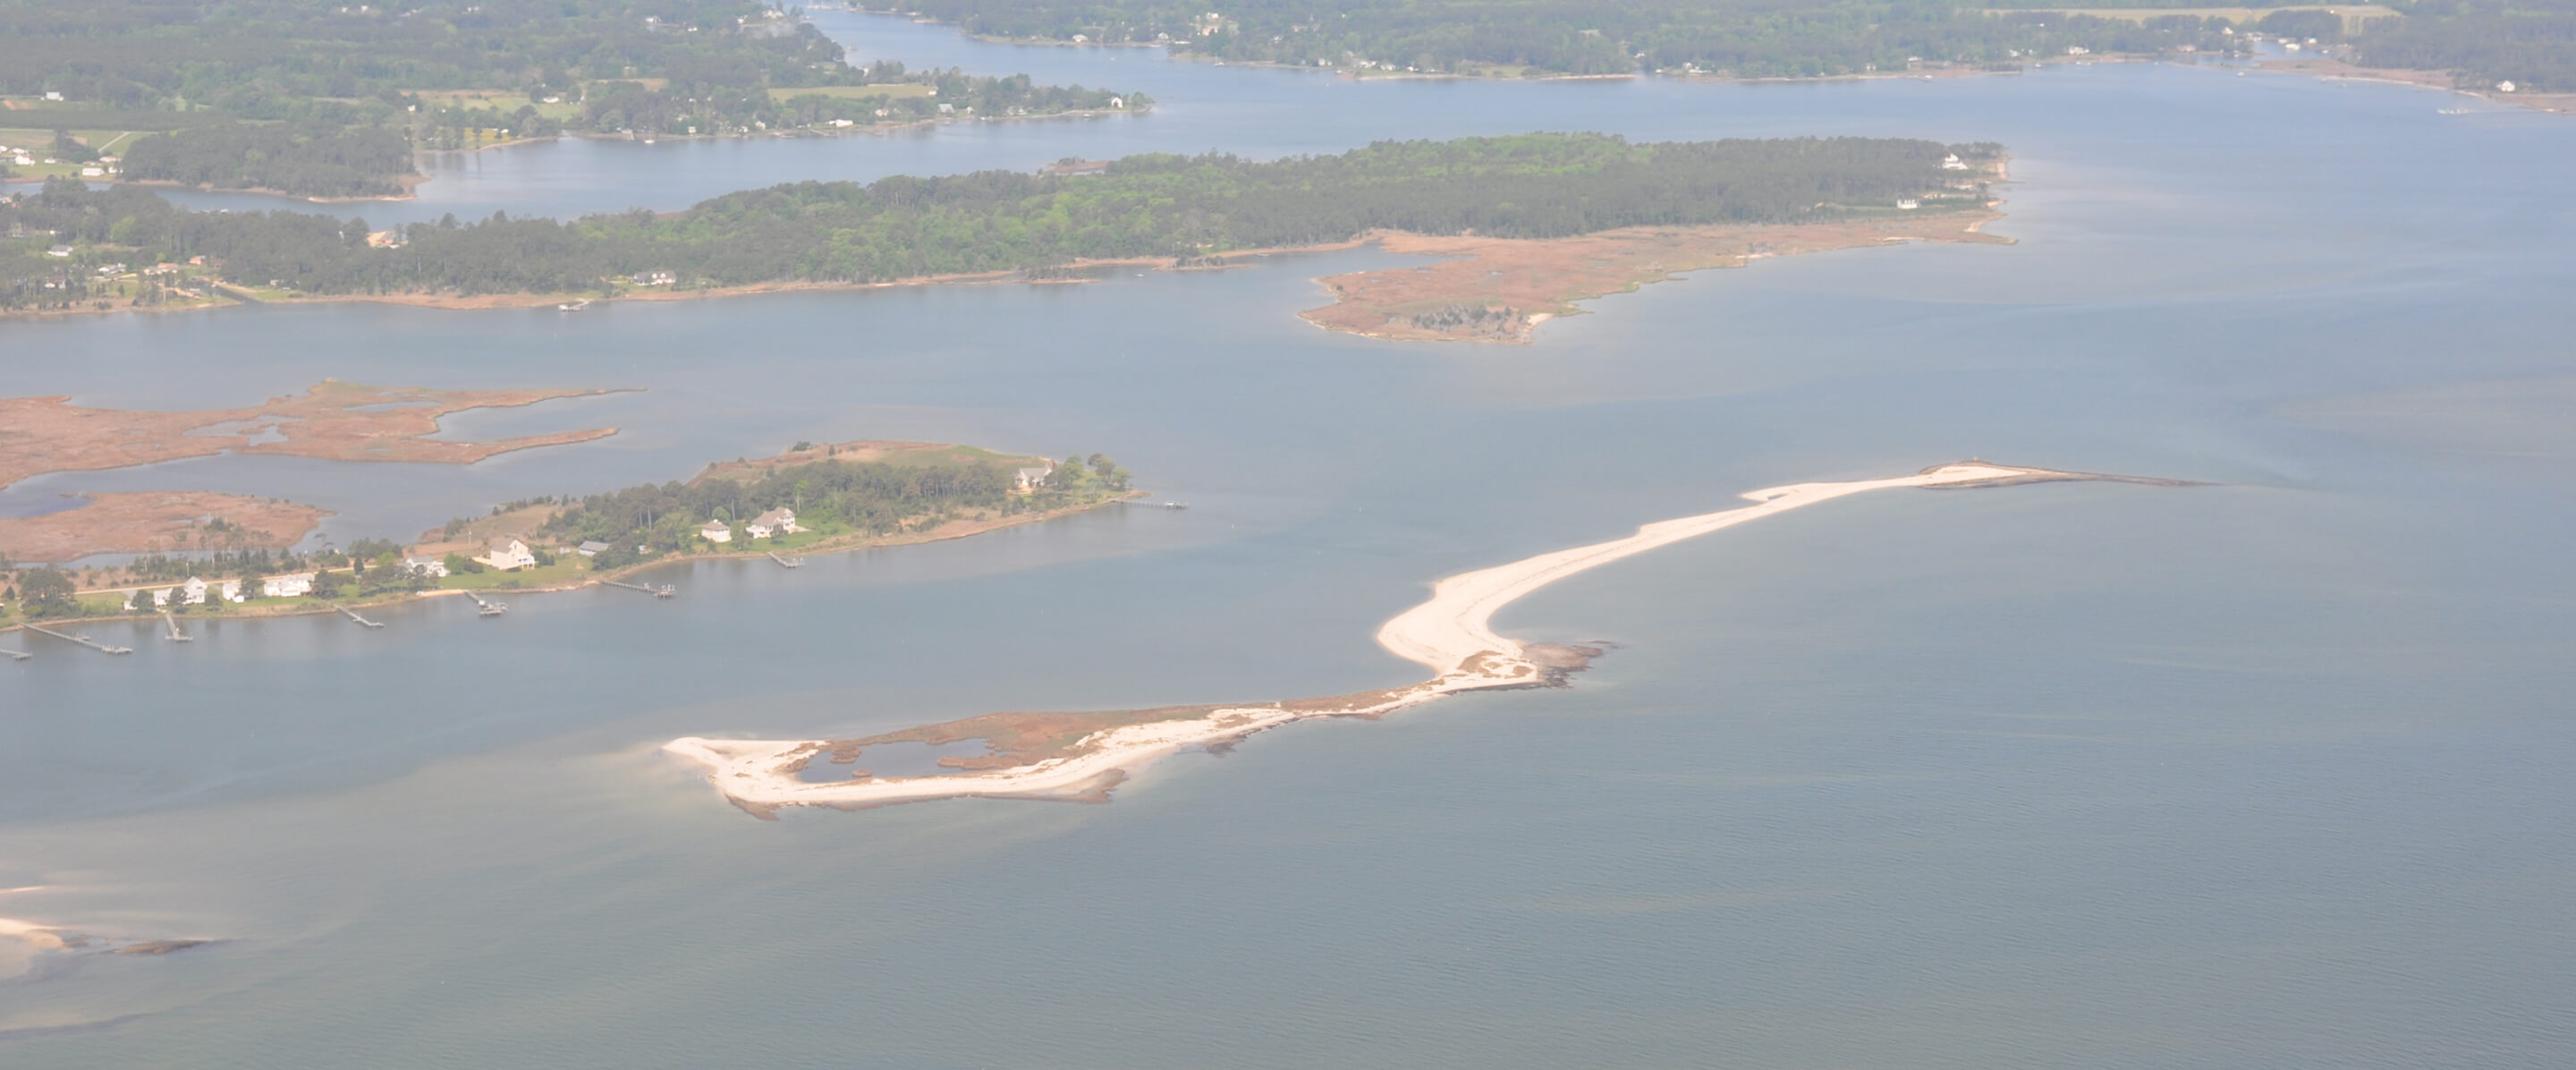
Eventually, the rising seas “drowned” the ancestral Susquehanna River forming the Chesapeake Bay about 10,000 years ago. But it wasn’t until about 2,000 – 3,000 years ago, as the rate of sea-level rise slowed from about 3.0 – 4.0 mm/year (11-16 inches per century) to 1.5–2.0 mm per year (roughly 6 – 8 inches per century), that sand could accumulate enough to form beaches.

Current Day
Today, sea-level rise rates have returned to the higher rates that existed before the beaches formed, posing new challenges for the Bay’s coastline and its ecosystems.
These are water levels recorded at three tide gauges by the National Oceanographic and Atmospheric Administration (NOAA) in the Chesapeake Bay. The rising water level trends (and the amount of uncertainty in those trends) are indicated by the numbers in the red shaped ovals. The trends vary from 3.87 ± 0.20 mm/yr (0.15 ± 0.008 inches per year) to 5.98 ± 0.20 mm/yr (0.24 ± 0.008 inches/yr) during the 20th and 21st centuries.
While these numbers might seem small, they have significant long-term effects, especially when the trend is consistent. For example, 4 mm/yr of sea-level rise adds up to about 20 cm (8 inches) in 50 years and 40 cm (16 inches) in 100 years. That might seem gradual, but it’s enough to impact low-lying areas like beaches. Also, seemingly small amounts of sea-level rise amplify the impacts of storms and flooding.
Data from https://tidesandcurrents.noaa.gov/sltrends
.avif)
